Hystrix服务监控
Hystrix除了熔断降级之外,还提供了准实时的调用监控,持续的记录所有通过Hystrix发起的请求的执行信息,并已统计报表的形式展示出来,包括有每秒执行多少请求,多少成功,多少失败等,通过hystrix-metrics-event-stream实现对以上指标的监控
依赖
1
2
3
4
| <dependency>
<groupId>org.springframework.cloud</groupId>
<artifactId>spring-cloud-starter-hystrix-dashboard</artifactId>
</dependency>
|
启动类配置
1
2
3
4
5
6
7
8
| @SpringBootApplication
@EnableHystrixDashboard
public class HystrixDashBoardApp {
public static void main(String[] args) {
SpringApplication.run(HystrixDashBoardApp.class,args);
}
}
|
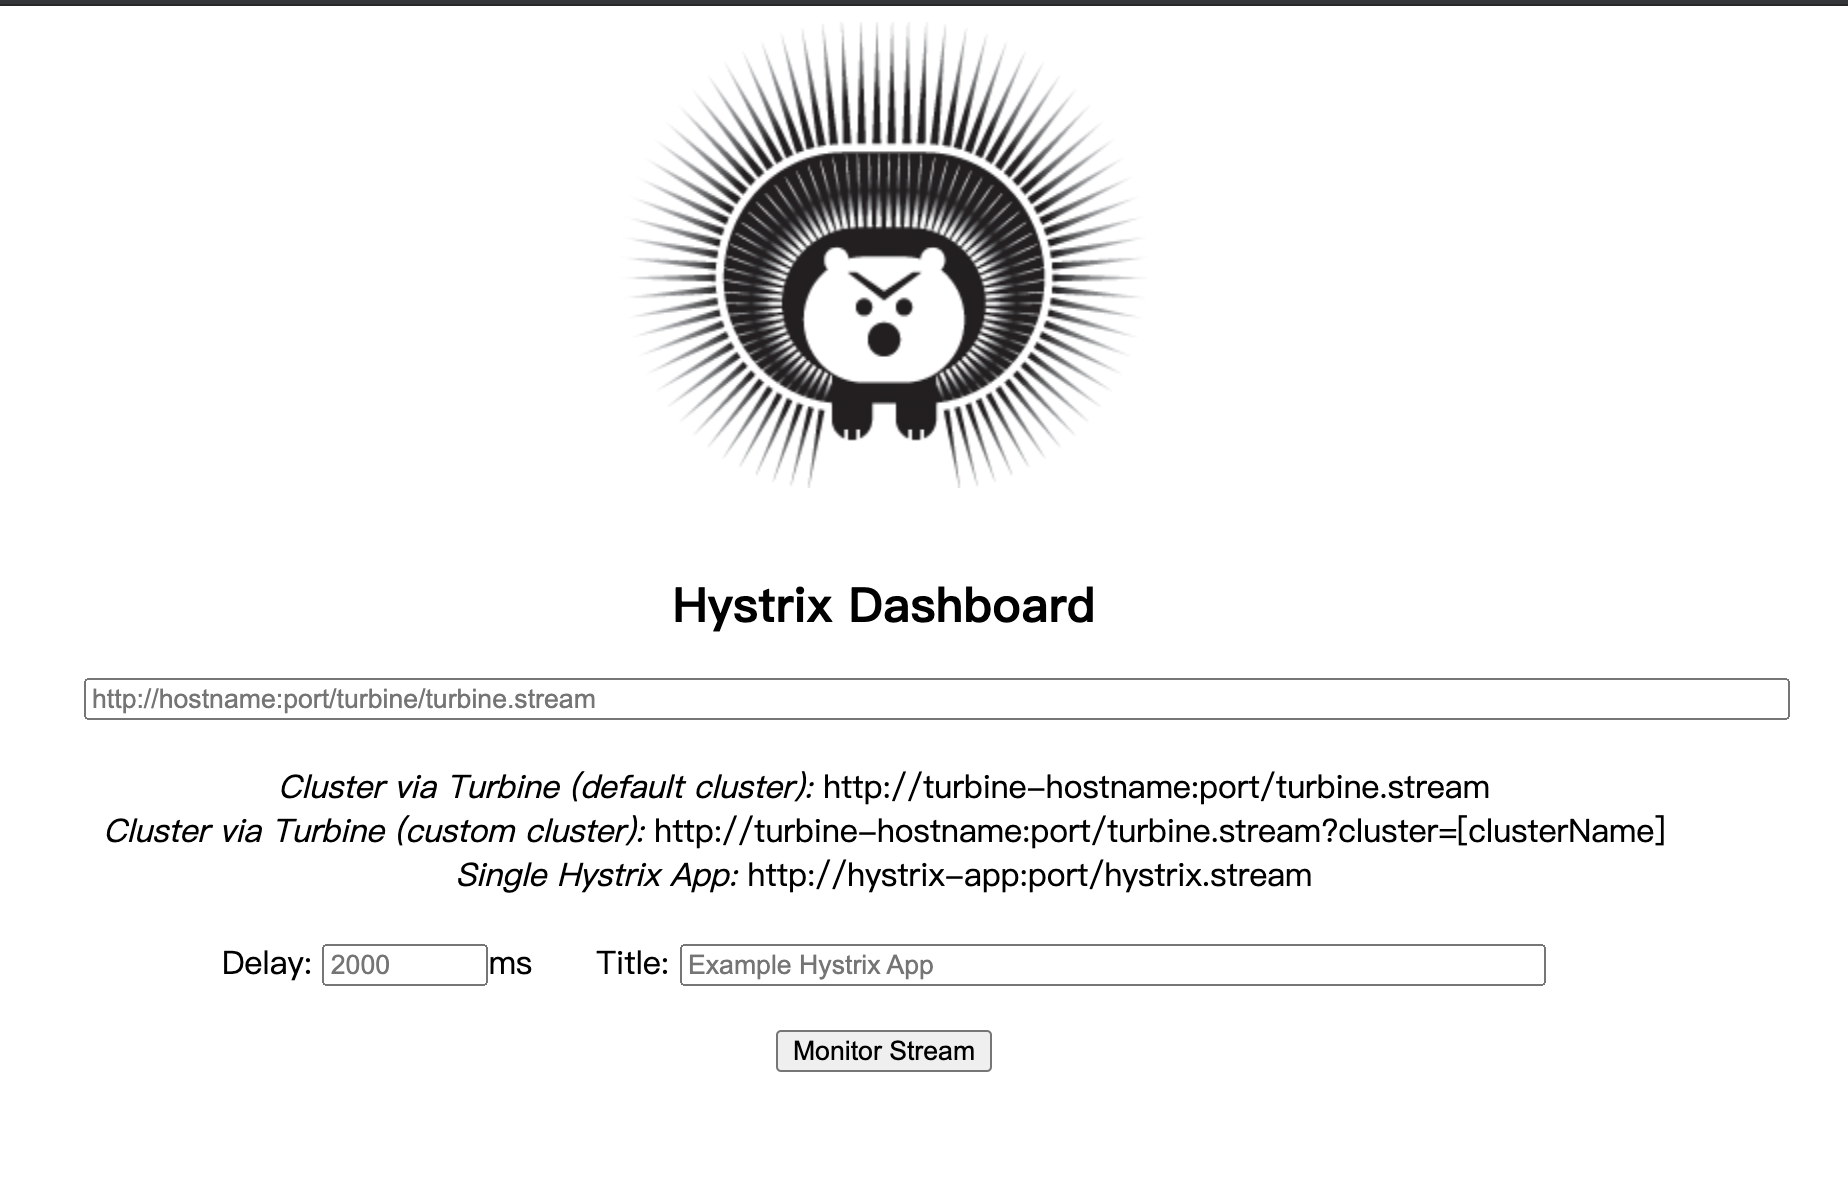
![监控面板页面]()
在监控的地址中填入地址
如果是单个服务,则填入
1
| http://ip:端口/hystrix.stream
|
Delay是指间隔时间,Title是指监控面板的标题,点击Monitor Stream即可监控服务
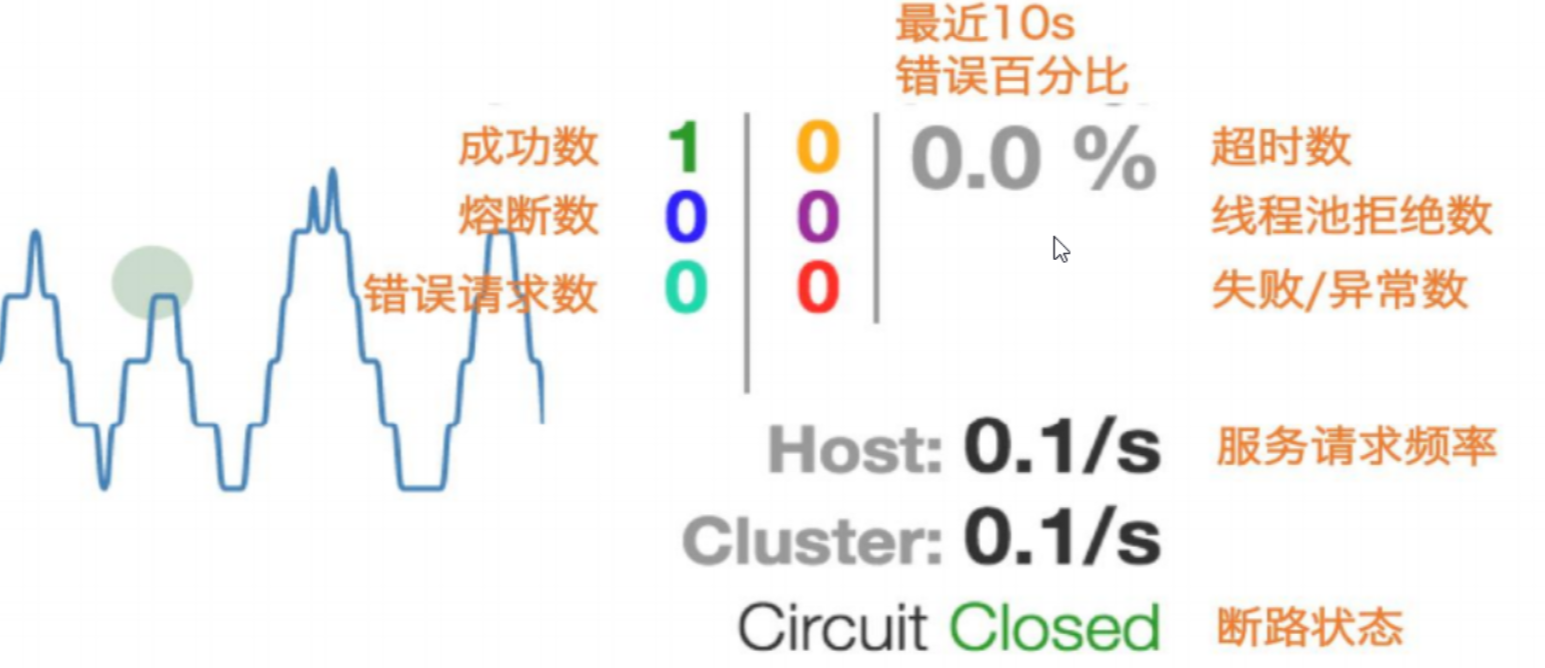
![指标页面]()
图中的实心圆有两种含义,颜色的变化代表了实例的健康程度,健康度从绿色->黄色->橙色->红色递减;大小也会根据实例的请求流量发生变化,流量越大实心圆越大
如果是turbine集群,则填入
1
| http://集群的ip:端口/turbine.stream?cluster=集群名称
|
turbine配置
增加依赖
1
2
3
4
| <dependency>
<groupId>org.springframework.cloud</groupId>
<artifactId>spring-cloud-starter-netflix-turbine</artifactId>
</dependency>
|
使用turbine来进行监控多个微服务
在启动类上添加注解@EnableTurbine
1
2
3
| turbine:
appConfig: springcloud2-consumer,springcloud2-provider
clusterNameExpression: "'default'"
|
其会监控springcloud2-consumer和springcloud2-provider
turbine-stream配置
还可以用turbine-stream来使用消息中间件收集数据,各个微服务将Hystrix Command的监控数据发送至消息中间件,Turbine消费消息中间件中的数据
上报服务使用依赖
1
2
3
4
5
6
7
8
9
| <dependency>
<groupId>org.springframework.cloud</groupId>
<artifactId>spring-cloud-netflix-hystrix-stream</artifactId>
</dependency>
<dependency>
<groupId>org.springframework.cloud</groupId>
<artifactId>spring-cloud-starter-stream-rabbit</artifactId>
</dependency>
|
聚集服务使用依赖
1
2
3
4
5
6
7
8
| <dependency>
<groupId>org.springframework.cloud</groupId>
<artifactId>spring-cloud-starter-turbine-stream</artifactId>
</dependency>
<dependency>
<groupId>org.springframework.cloud</groupId>
<artifactId>spring-cloud-starter-stream-rabbit</artifactId>
</dependency>
|
启动类使用注解@EnableTurbineStream,此时在服务中使用rabbitmq的配置即可,不需要使用turbine的配置